2D Plots
A 2D plot is a plot of any variable present in the 2D property list. Generally speaking these are variables that “make sense to talk about on a surface” We give the basic introduction to these in the basic plot tutorial. In this section we’ll provide detailed operations
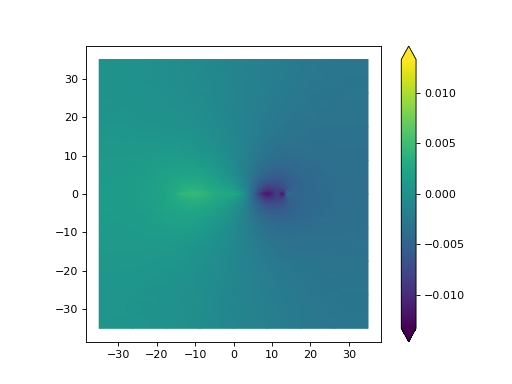
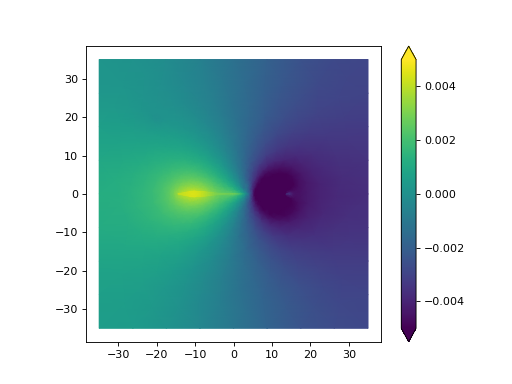
Importantly there are 4 types of color scales. A None colorscale sets the range of the colorbar “Standard” i.e.
between max and mix. A full colorbar centers the colorbar at zero and extends the color range to the min and the
max of the data (i.e. the “color slope” for positive nubers is different for negative). A equal colorscale set the
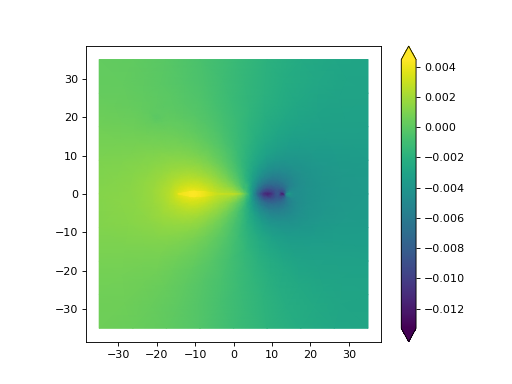
max and min to the larges magnitude value i.e. the intermediate color represents a “true 0”. Lastly is an array of two
numbers is set then the colorbar will scale between the two numbers.
import matplotlib.pyplot as plt
from fish2eod import BaseFishModel, Circle, plotting
"""
Boilerplate to solve the model
"""
class PreyClass(BaseFishModel):
def add_geometry(self, **kwargs):
prey = Circle((3, 2), 0.5)
self.model_geometry.add_domain("prey", prey, sigma=1)
model = PreyClass()
parameters = {"fish_x": [-15, 15], "fish_y": [0, 0]}
model.compile(**parameters)
model.solve(**parameters)
"""
Plot showing effect of color_style and flags
The colorbar flag turns the colorbar on or off
The mask flag sets the mask (requires valid mask)
"""
model_solution = model.solution # pull solution
plt.figure()
plotting.mesh_plot_2d(
model_solution, "solution", colorbar=True, mask=None, color_style="Full"
) # plot the result named solution
plt.figure()
plotting.mesh_plot_2d(
model_solution, "solution", colorbar=True, mask=None, color_style="Equal"
) # plot the result named solution
plt.figure()
plotting.mesh_plot_2d(
model_solution, "solution", colorbar=True, mask=None, color_style=None
) # plot the result named solution
plt.figure()
plotting.mesh_plot_2d(
model_solution, "solution", colorbar=True, mask=None, color_style=[-0.005, 0.005]
) # plot the result named solution
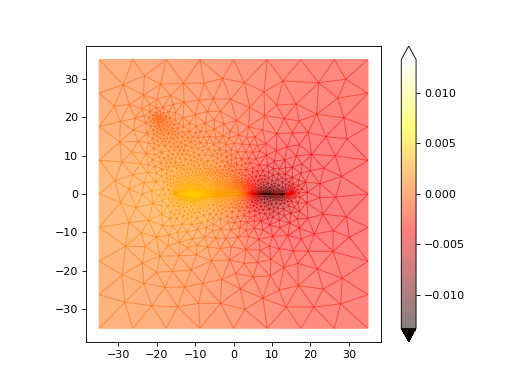
"""
Plots also take standard matplotlib properties
Here we change the colormap and the alpha chanel
"""
plt.figure()
plotting.mesh_plot_2d(model_solution, "solution", cmap="hot", alpha=0.5)

