Basics
This tutorial assumes that you’ve already read the Basic tutorial. We will use a common model of
a fish with an object near the head. The details are not important as all Model descendants will behave similarly.
The solution object is actually a plotting data structure. All plotting functions will require this along with
some configuration settings. We’ll cover the two basic plots in this section: solutions and outlines.
Plots are broken into 2D and 1D plots. 2D plots describe a function over the space: for example the EOD, the model conductance as a function of position, or the domains. 1D plots describe a function on the boundaries - the simplest on is the outline which is outline = 1 if an edge describes the geometry outline and outline = 0 otherwise.
The solution object has several fields corresponding to different properties they are
- 2D properties
solution
active (only present if image computed)
domain
sigma
- 1D properties
boundary
outline
- Misc properties
SkinStructure
ElectricImage
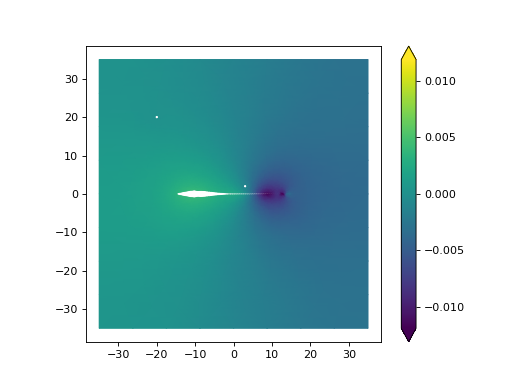
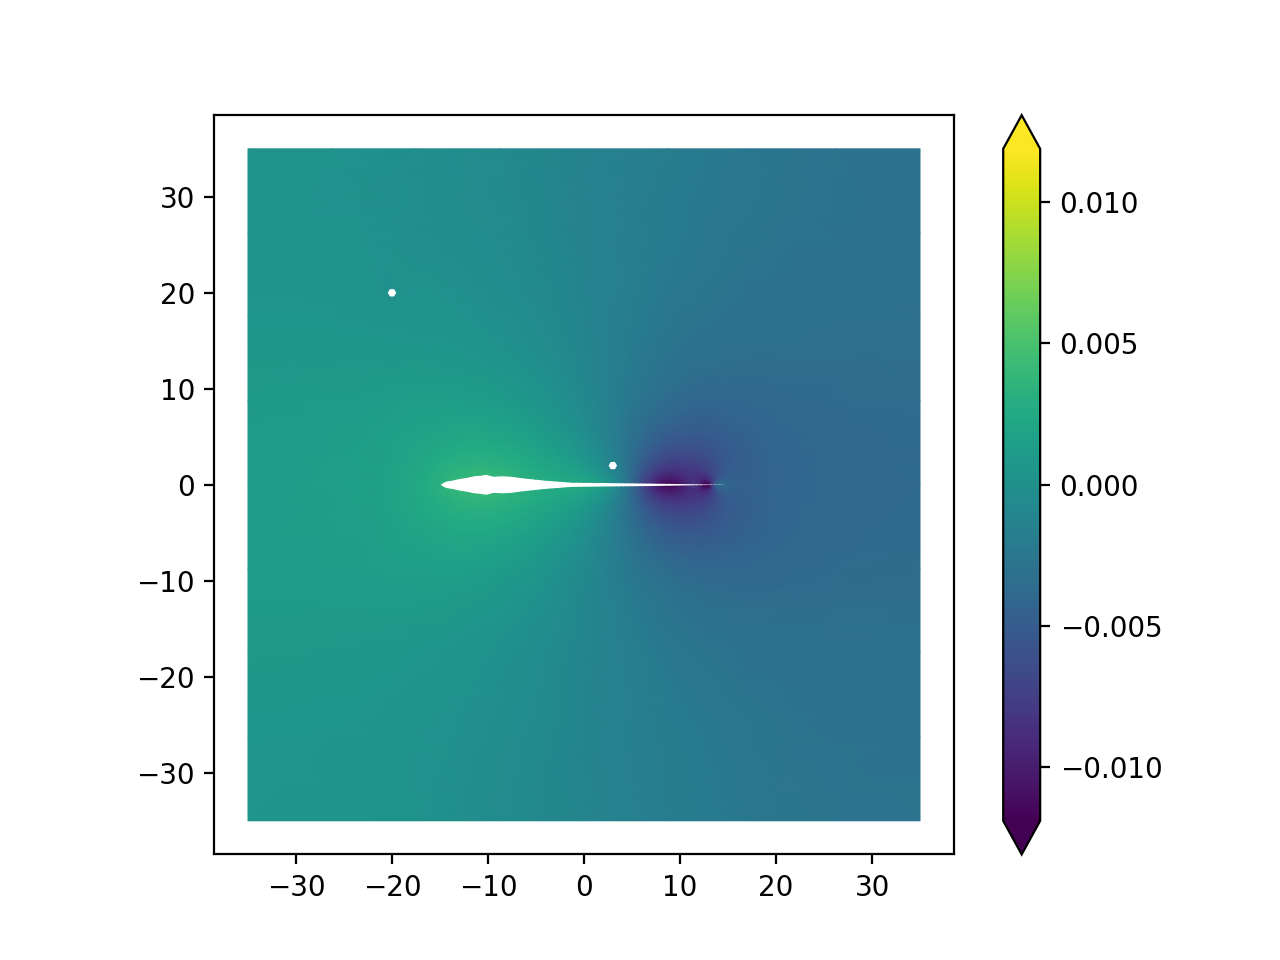
Plot Solution
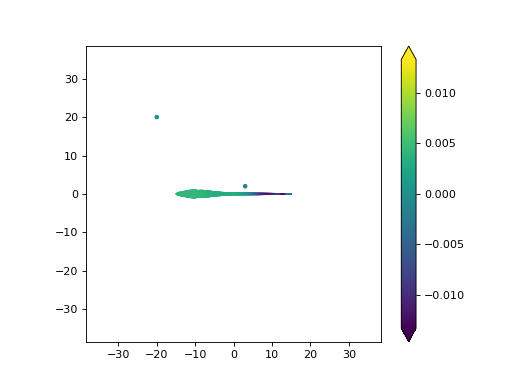
The solution field contains the “most resent” simulation result. I.e. the voltage from the EOD (note however that if
the field perturbation is computed to compute the electric image them solution is the field perturbation and an
additional variable active is created which contains the “raw EOD”.
from fish2eod import BaseFishModel, Circle, plotting

"""
Boilerplate to solve the model
"""


class PreyClass(BaseFishModel):
    def add_geometry(self, **kwargs):
        prey = Circle((3, 2), 0.5)

        self.model_geometry.add_domain("prey", prey, sigma=1)


model = PreyClass()
parameters = {"fish_x": [-15, 15], "fish_y": [0, 0]}
model.compile(**parameters)
model.solve(**parameters)

"""
Extract the solution object

Plot the "FEM solution"
"""

model_solution = model.solution  # pull solution
plotting.mesh_plot_2d(model_solution, "solution")  # plot the result named solution
(Source code, png, hires.png, pdf)

Here where we specify the “solution” variable we could have used any valid 2D function.
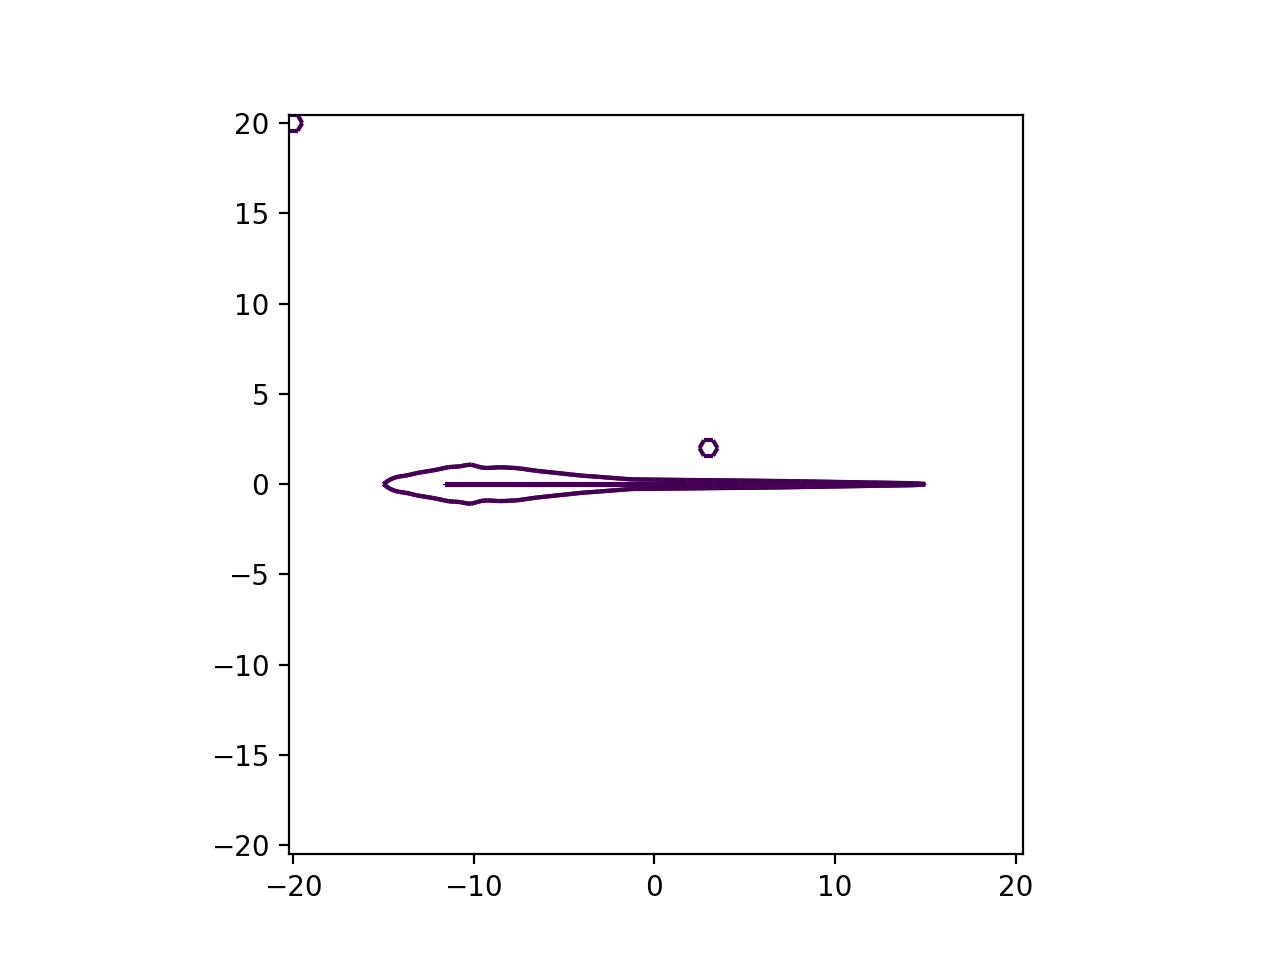
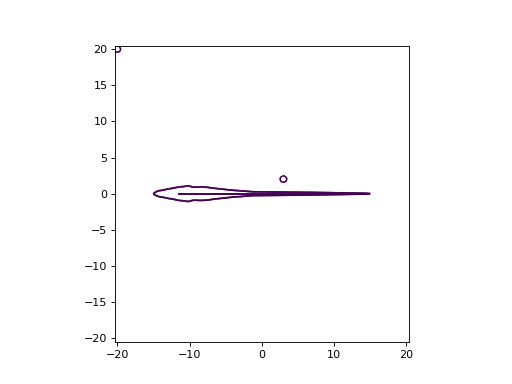
Plot Outline
Technically the outline can be computed from a 1D plot - however we’ve provided a helper function to do so. All thats
needed is to call the plot_outline function.
from fish2eod import BaseFishModel, Circle, plotting

"""
Boilerplate to solve the model
"""


class PreyClass(BaseFishModel):
    def add_geometry(self, **kwargs):
        prey = Circle((3, 2), 0.5)

        self.model_geometry.add_domain("prey", prey, sigma=1)


model = PreyClass()
parameters = {"fish_x": [-15, 15], "fish_y": [0, 0]}
model.compile(**parameters)
model.solve(**parameters)

"""
Extract the solution object

Plot the "FEM solution"
"""

model_solution = model.solution  # pull solution
plotting.plot_outline(model_solution)  # plot the result named solution
(Source code, png, hires.png, pdf)
Masking
In many cases some information is included in the plot that you don’t want. For example inside the fish is usually “not interesting” so this can be masked out.
import matplotlib.pyplot as plt

from fish2eod import BaseFishModel, Circle, plotting

"""
Boilerplate to solve the model
"""


class PreyClass(BaseFishModel):
    def add_geometry(self, **kwargs):
        prey = Circle((3, 2), 0.5)

        self.model_geometry.add_domain("prey", prey, sigma=1)


model = PreyClass()
parameters = {"fish_x": [-15, 15], "fish_y": [0, 0]}
model.compile(**parameters)
model.solve(**parameters)

"""
Extract the solution object

Plot the "FEM solution"
Mask only the water (outside fish)
"""

model_solution = model.solution  # pull solution
mask = plotting.generate_mask(model.solution, include_domains=("water",))
plotting.mesh_plot_2d(model_solution, "solution", mask=mask)  # plot the result named solution

# For convenience you can also exclude a domain by setting include=False
plt.figure()
mask = plotting.generate_mask(model.solution, include_domains=("water",), include=False)
plotting.mesh_plot_2d(model_solution, "solution", mask=mask)  # plot the result named solution
Additionally it may be more convenient to set a certain domain to be ommitted rather than have a long list of included
domains. For this reason we provide an include flag to set whether the mask is inclusive or exclusive.
Sweeps
Plotting during sweeps is almost the same as for regular plotting. You just need to specify the sweep parameter values
Note that because of the way matplotlib works we cannot pass properties as prop_0 = 0 but we need to specify the
properties argument. This is necessary to provide the flexibility of passing arbitrary matplotlib settings.
Not that setting the properties argument does not influence any other settings and this can be used in concert with all other flags and settings.
from itertools import product
from tempfile import TemporaryDirectory
import matplotlib.pyplot as plt
from fish2eod import (
BaseFishModel,
Circle,
IterativeSolver,
ParameterSet,
ParameterSweep,
load_from_file,
plotting,
)
"""
Boilerplate to solve the model
"""
class PreyClass(BaseFishModel):
def add_geometry(self, prey_x, prey_y, **kwargs):
prey = Circle((prey_x, prey_y), 0.5)
self.model_geometry.add_domain("prey", prey, sigma=1)
d = TemporaryDirectory()
prey_x = ParameterSet("prey_x", prey_x=[3, 6], rebuild_mesh=True)
prey_y = ParameterSet("prey_y", prey_y=[2, 4], rebuild_mesh=True)
parameter_sweep = ParameterSweep(prey_x, prey_y)
it = IterativeSolver("temp", d.name, PreyClass, parameter_sweep, fish_x=[-15, 15], fish_y=[0, 0])
it.run()
"""
Extract the solution object
Plot the "FEM solution"
"""
loaded_solution = load_from_file(d.name + "/temp")
prey_x_values = loaded_solution.parameter_levels["prey_x"]
prey_y_values = loaded_solution.parameter_levels["prey_y"]
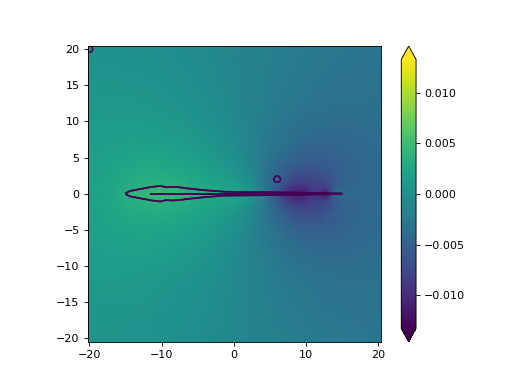
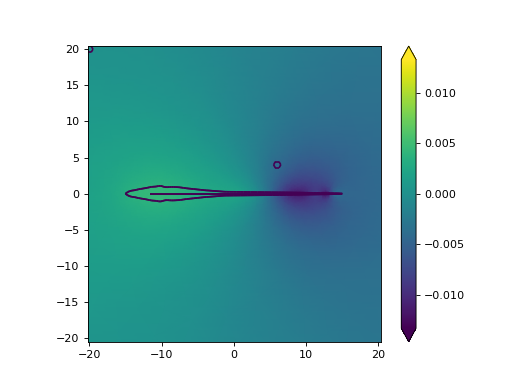
for prey_x, prey_y in product(prey_x_values, prey_y_values):
plt.figure()
# pass the solution parameters in an additional dictionary.
# all other arguments can be used as normal
plotting.mesh_plot_2d(loaded_solution, "solution", prey_x=prey_x, prey_y=prey_y)
plotting.plot_outline(loaded_solution, prey_x=prey_x, prey_y=prey_y)


