Geometry
Warning
It’s very important to have read the previous section on what a model is and how they’re defined. Please see the model tutorial for this explanation.
In fish2eod geometry is the physical content of a model - it’s the tank, the fish, electrodes; any physical region. These regions form boundaries and domains which are used to specify the physics on the model (for an intro on this see our finite element introduction).
Geometry Basics
There are 3 primitive types of geometry in fish2eod: circles, rectangles and polygons which in principle can be used to create an arbitrarily complex environment.
The natural unit for all created geometries is cm i.e. a radius=1 implies a 1cm radius. For full details on the
geometry api please see the Primitives Module
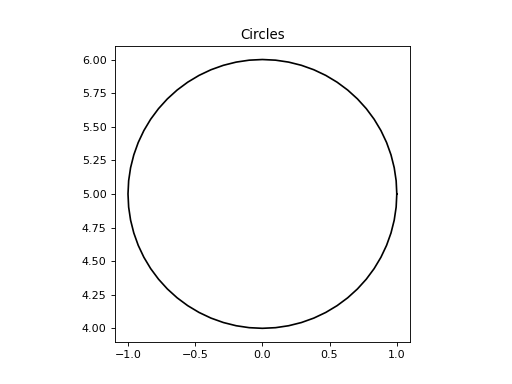
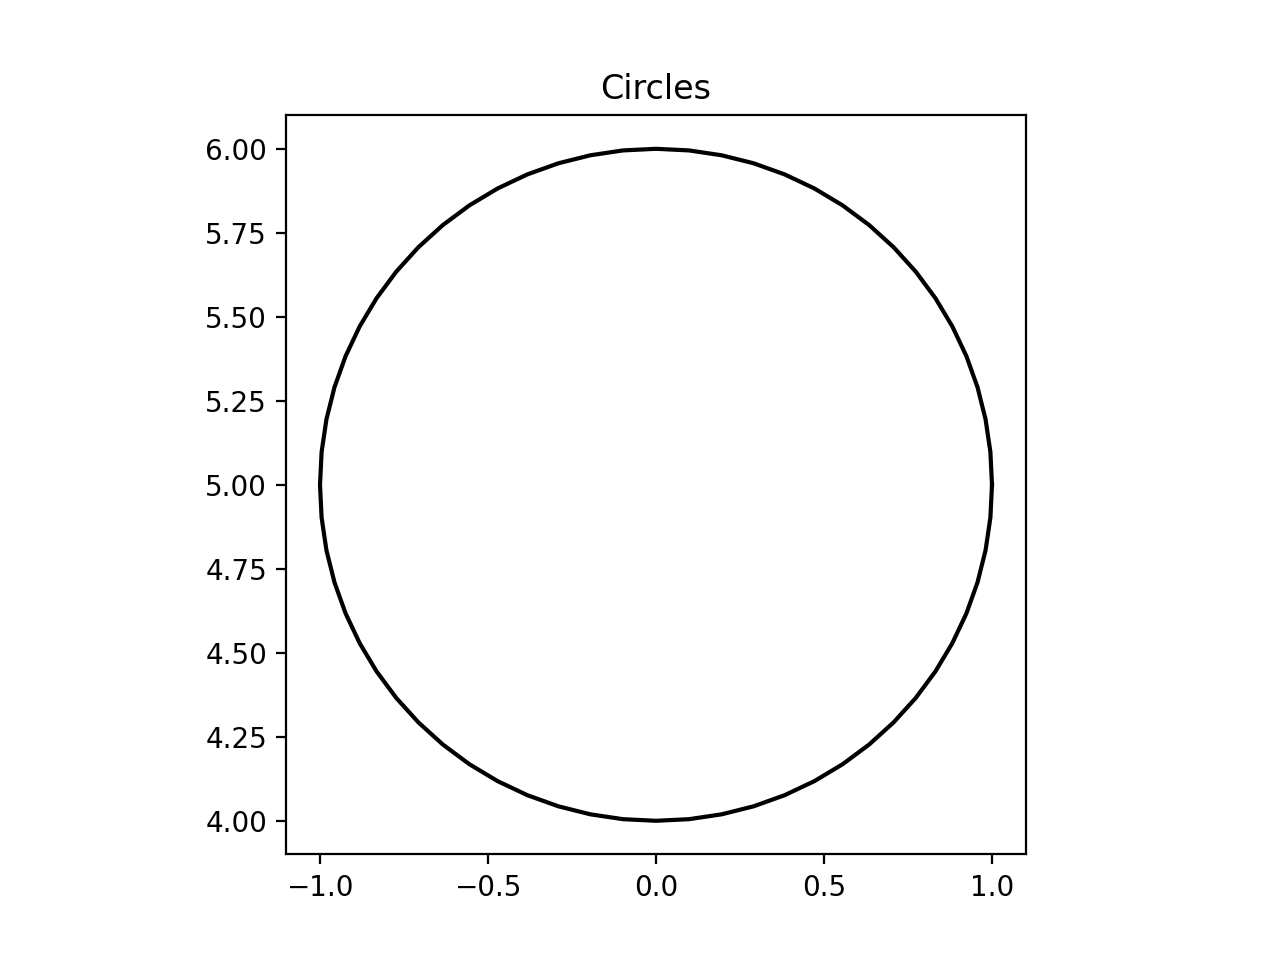
Circles
Circles are defined from a center point and a radius. Here we will create a circle with a 1cm radius centered at the point (0,5).
"""Example with how to create a circle."""
import matplotlib.pyplot as plt

from fish2eod import Circle

r = 1  # 1cm radius
p = [0, 5]  # location of center (x,y) = (0cm, 5cm)
circle = Circle(p, r)
circle.draw()  # this is for display purposes and not necessary for the general use
plt.title("Circles")
(Source code, png, hires.png, pdf)

For full circle documentation please see the Circle class
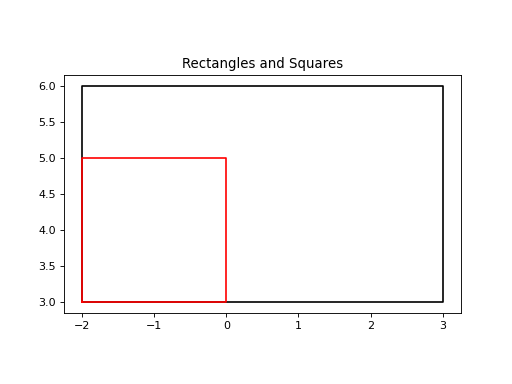
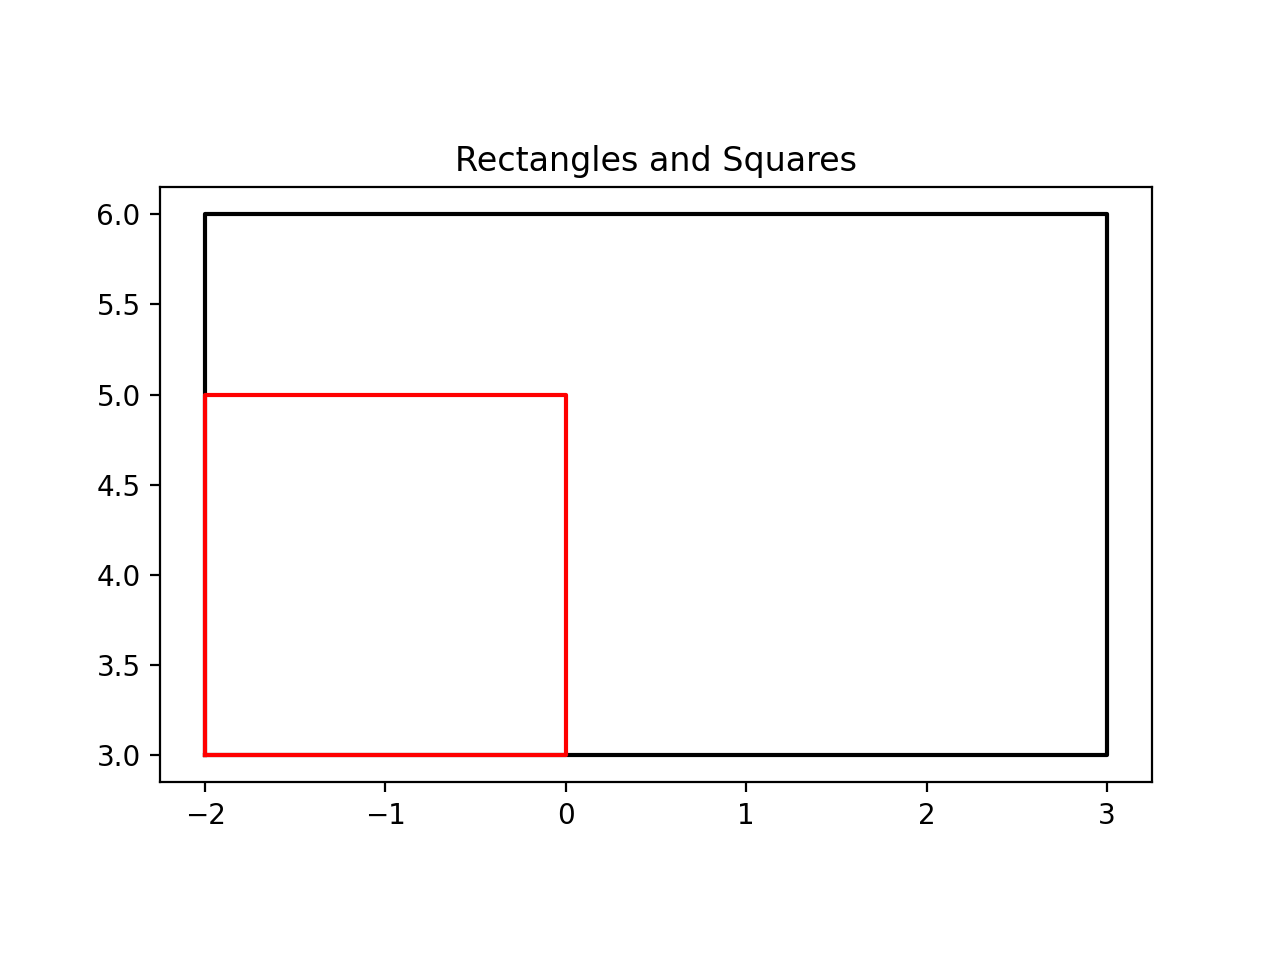
Rectangles
Rectangles are defined relative to the bottom left corner with a given width (horizontal) and height (vertical) for convenience if the height is omitted then the height is assumed to equal the width (i.e. a square).
Here we’ll create a 5x3 rectangle with its bottom left corner situated at the point (-2,3). And a 2x2 square starting from the same point.
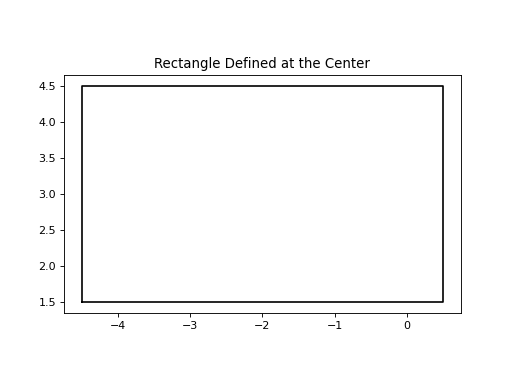
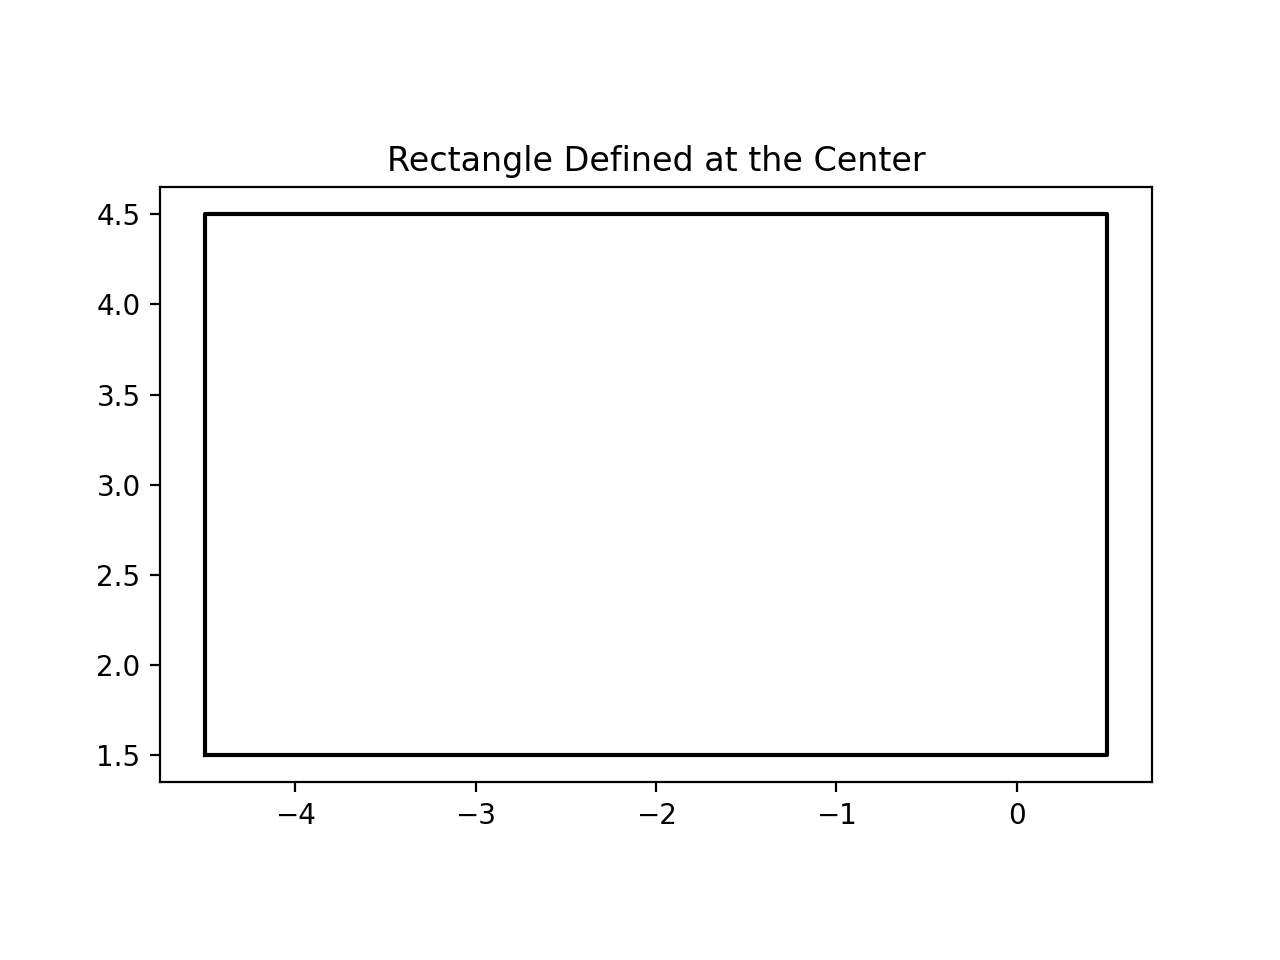
For convenience if defining the rectangle from its center is more convenient, for example a background centered at (0,0)
this can also be done with the from_center method as shown below.
For full circle documentation please see the Rectangle class
"""Example with how to create a rectangle."""
import matplotlib.pyplot as plt

from fish2eod import Rectangle

"""
Create a stock-behaviour rectangle.
"""
w = 5  # 5cm wide
h = 3  # 3cm high
p = [-2, 3]  # location of bottom-left (x,y) = (-2cm, 3cm)
rectangle = Rectangle(p, w, h)
plt.figure()
plt.title("Rectangles and Squares")
rectangle.draw()  # this is for display purposes and not necessary for the general use

"""
For simplicity if you want a square i.e. w=h then you need only provide the length.
"""
square = Rectangle(p, 2)
square.draw(color="r")  # color is used to specify the line color of the shape

"""
Additionally it's sometimes natural to define a square from its center

We have the optional 'constructor' from_center to do this.
Here we create an identical rectangle to the first one - except instead of `p` representing the bottom left corner we
have p representing the center of the rectangle.

Similarly to a "normal" rectangle the height can be omitted to create a square w=h.
"""
plt.figure()
plt.title("Rectangle Defined at the Center")
center = [0, 0]
center_rectangle = Rectangle.from_center(p, w, h)
center_rectangle.draw()

Polygons
When combining circles and rectangles is insufficient to replicate your geometry you can use a polygon to replicate complex geometry.
Note
In general it is inadvisable to use polygons unless absolutely necessary as they are more computationally expensive than their square/circle counterparts (by several orders of magnitude: think seconds instead of milliseconds.) For example an ‘L’ shape would be better created by two perpendicular rectangles than a polygon, whereas a curve must be created by a polygon
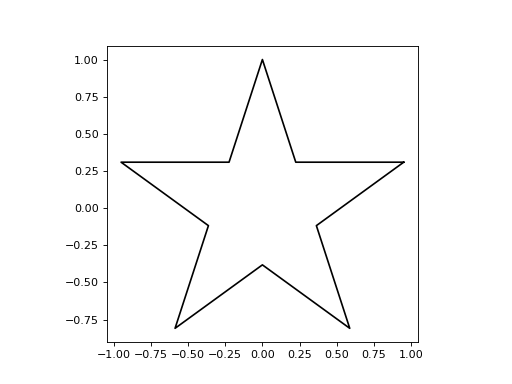
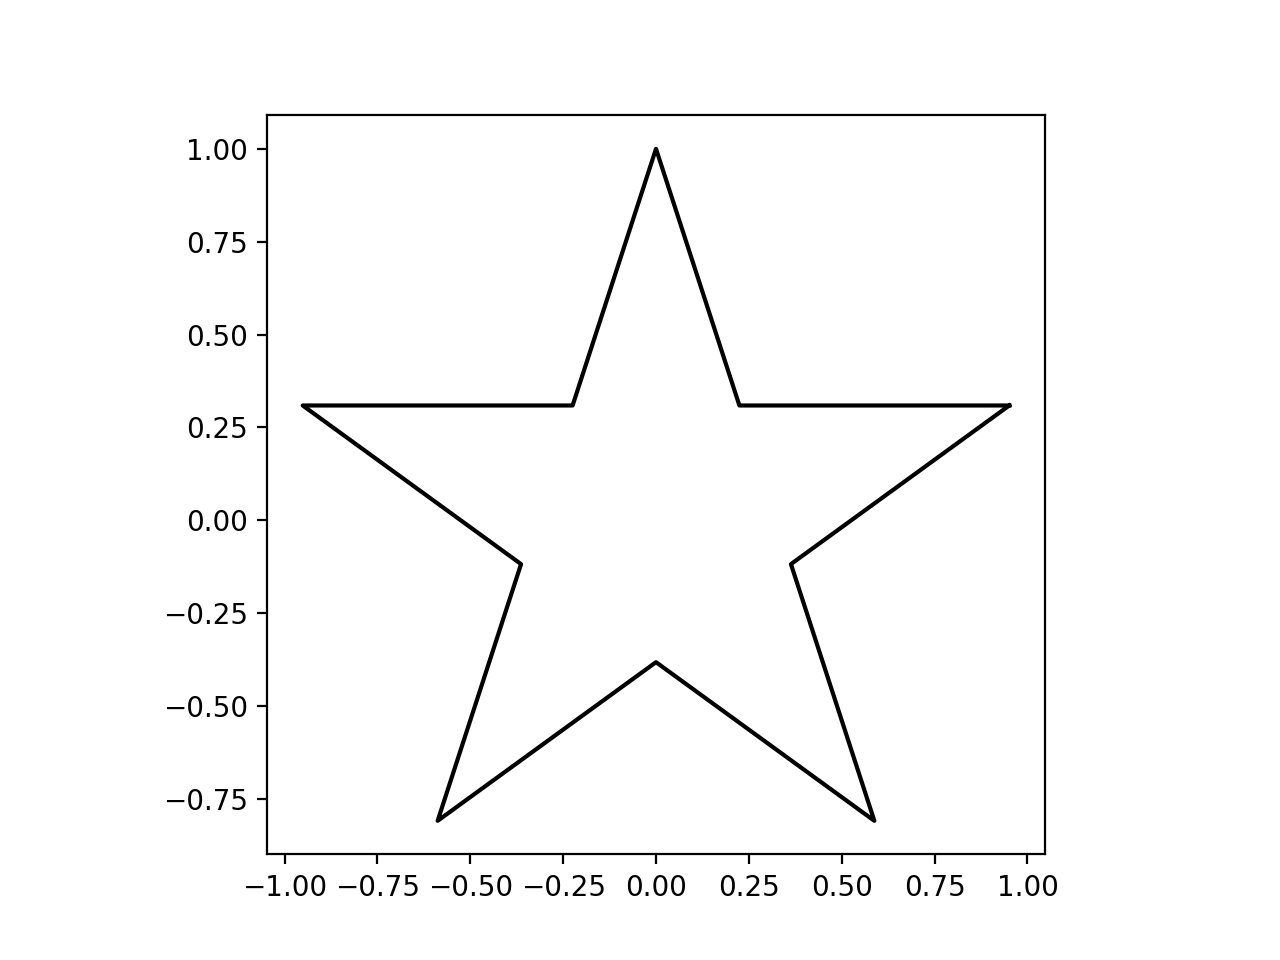
For illustration we will create a star using pre-defined coordinates
"""Example with how to create a polygon.

Note to users - please avoid polygons where possible as they are quite expensive.
"""
from fish2eod import Polygon

x = [
    0.95105652,
    0.22451399,
    0.0,
    -0.22451399,
    -0.95105652,
    -0.36327126,
    -0.58778525,
    0.0,
    0.58778525,
    0.36327126,
]
y = [
    0.30901699,
    0.30901699,
    1.0,
    0.30901699,
    0.30901699,
    -0.11803399,
    -0.80901699,
    -0.38196601,
    -0.80901699,
    -0.118034,
]

polygon = Polygon(x, y)
polygon.draw()  # this is for display purposes and not necessary for the general use
(Source code, png, hires.png, pdf)

Warning
Polygons must not be closed i.e. the last point implicitly connects to the first point.
For full polygon documentation please see the Polygon class
Integrating Geometries into Models
Making geometries starts with creating a subclass of the parent model (BaseFishModel).
BaseFishModel
Adding geometry is quite simple and there’s only one thing to know: Adding a domain or objects to a model is handled
by the add_geometry method.
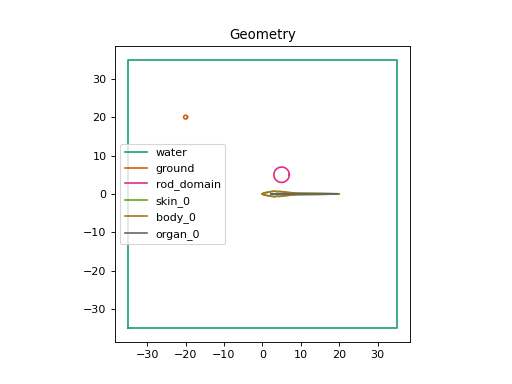
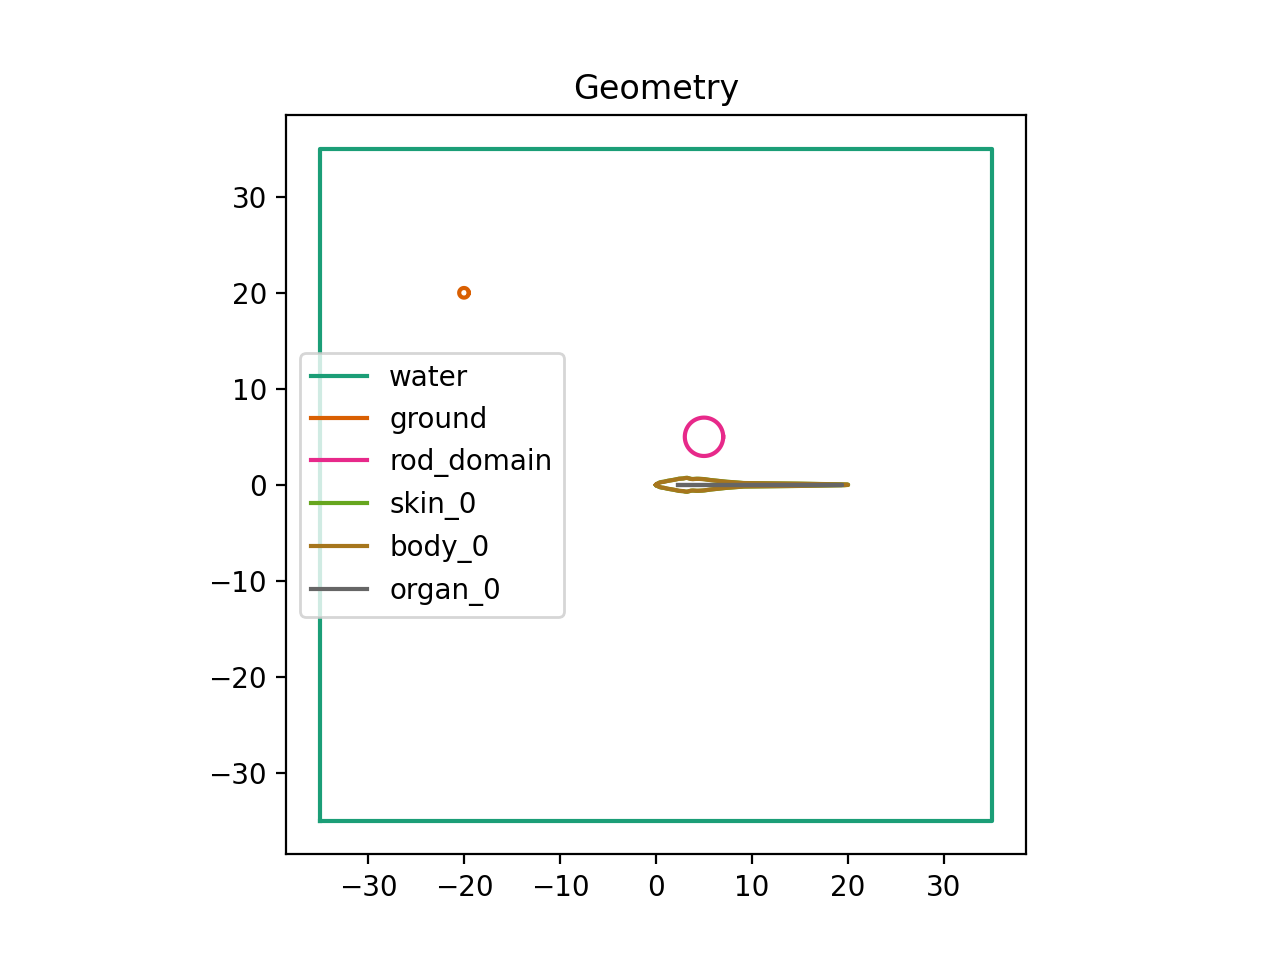
Here we’ll present a fish model with a 2cm radius metal rod at (5cm, 5cm) - we will call this domain the “rod_domain”
Note
Please ignore the fish_x portion of the code this will be explained in the
parameters tutorial.
"""Example model showing how to work with model geometry in the BaseFishModel."""
import matplotlib.pyplot as plt

from fish2eod import BaseFishModel, Circle


class ExampleWithGeometry(BaseFishModel):
    """Example model with geometry"""

    def add_geometry(self, **kwargs):
        rod = Circle([5, 5], 2)
        self.model_geometry.add_domain("rod_domain", rod, sigma=1e6)


"""
Create and compile the model
"""
model = ExampleWithGeometry()
model.compile(fish_x=[0, 20], fish_y=[0, 0])  # ignore this for now.

"""
Plot the outline of the model.
"""
plt.figure()
model.plot_geometry(legend=True)
plt.title("Geometry")
(Source code, png, hires.png, pdf)

You may notice a few lines of code that you haven’t seen before. model.compile() compiles the model i.e. integrating
everything you’ve specified in your description. and model.draw_geometry() does exactly what it sounds like - it draws
the outline of each object with a unique color for each domain.
Additionally the argument sigma=1e6 means that this domain has a conductance of 1e6 S/cm - any positive number (valid
conductance) can be used here.
For a full documentation on these methods please see the compile and the plot_geometry methods.