Domains
This tutorial assumes that you’ve already read the geometry tutorial.
Simple Domain Assignment
As before we will create a model BaseFishModel and highlight the domains
"""Example model where we show domains."""
import matplotlib.pyplot as plt

from fish2eod import BaseFishModel

"""
Create and compile the model.

Additionally plot the domains at different scales do see the detail
"""
model = BaseFishModel()
model.compile(fish_x=[-30, 30], fish_y=[0, 0])  # ignore this for now

plt.figure()
model.plot_domains()

plt.figure()
model.plot_domains()
plt.xlim([-30.1, -29.6])
plt.ylim([-0.1, 0.1])

plt.figure()
model.plot_domains()
plt.xlim([-25, -22])
plt.ylim([-2, 2])


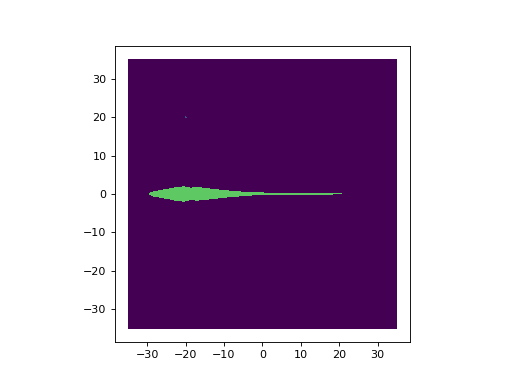
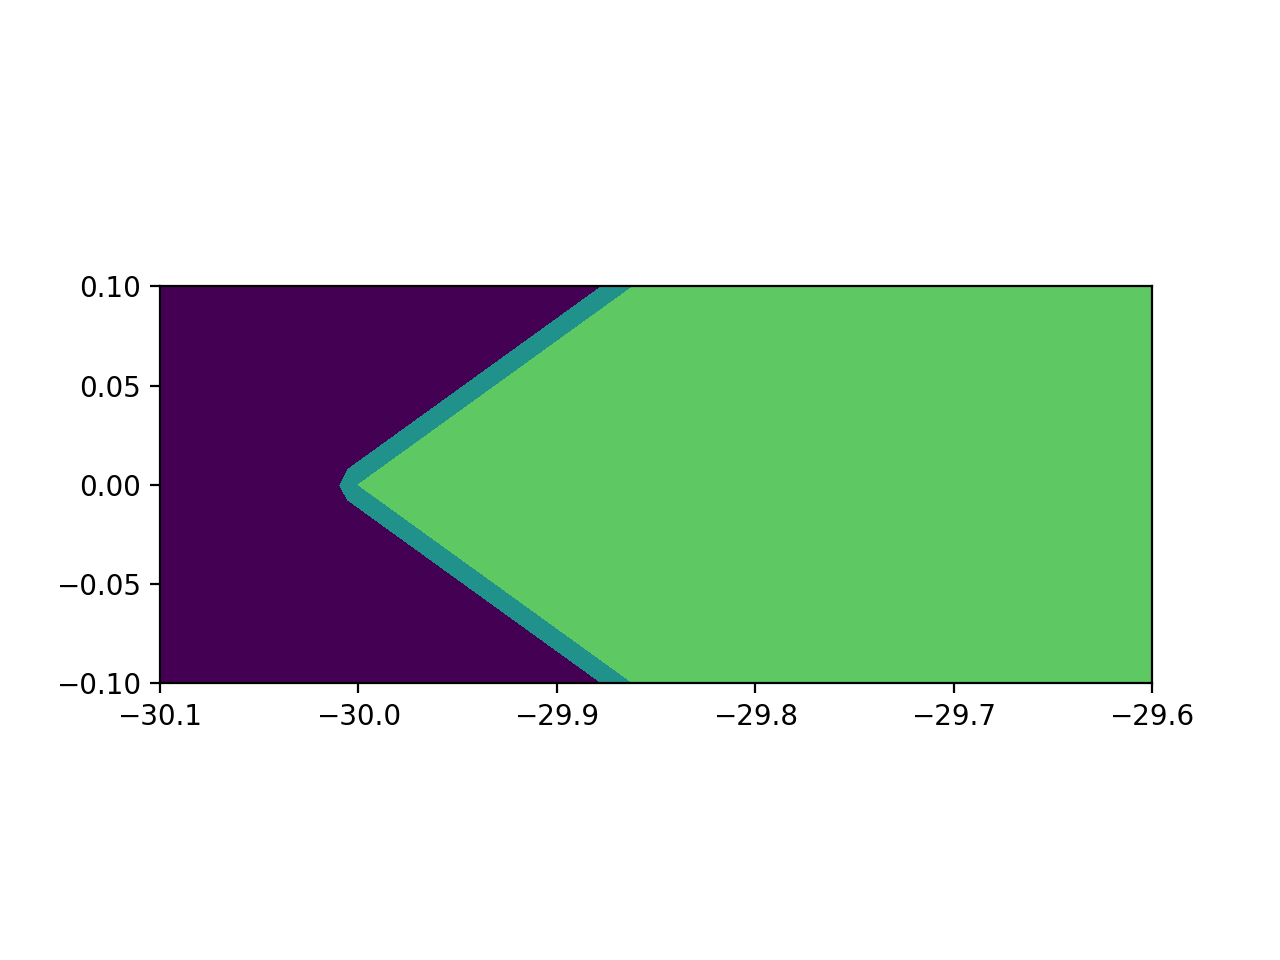
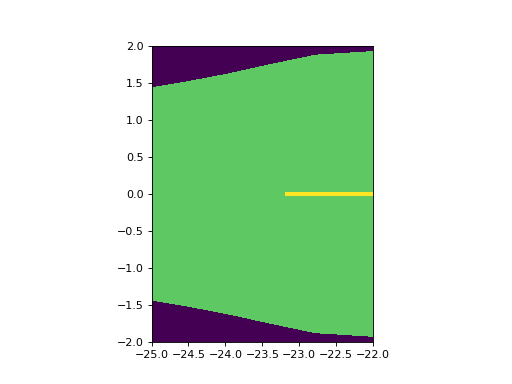
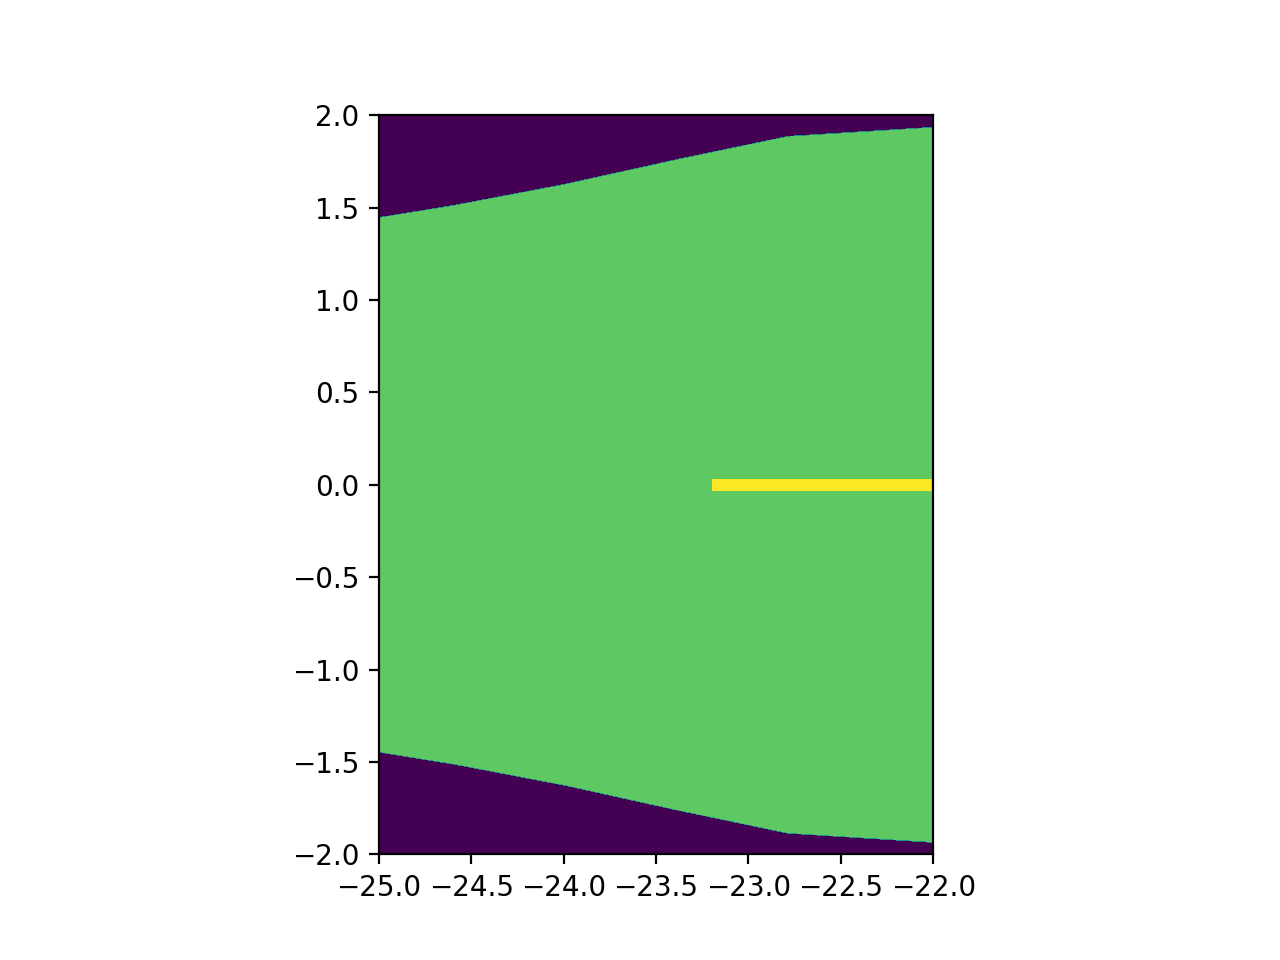
Here we can see 5 domains
Background water/tank (purple)
Electrode in the top left of figure 1 (blue)
Fish Body (green)
Fish skin in figure 2 (greenish-bluish)
Electric organ in figure 3 (yellow)
The model.plot_subdomains code is what generates the figures.
Overlapping Domains
Warning
If you can get away without overlapping geometries and domains - do that. When domains overlap you must be careful about the order geometries are added. As the domains will be assigned in that order.
For this example we will have a circle overlap a square with a lower conductance
"""Example model where we show overlapping domains."""
from fish2eod import BaseFishModel, Circle, Rectangle
class StackingClass(BaseFishModel):
"""Example class highlighting domain order."""
def add_geometry(self, **kwargs):
circle = Circle([5, 10], 5)
square = Rectangle([5, 10], 10, 10)
# the circle is added before the square meaning the square will obscure the circle
self.model_geometry.add_domain("bottom", circle, sigma=1)
self.model_geometry.add_domain("top", square, sigma=2)
"""
Returning to default behaviour.
Since the square was added second it overwrites any domain that it touches. Such as the quarter circle it overlaps.
"""
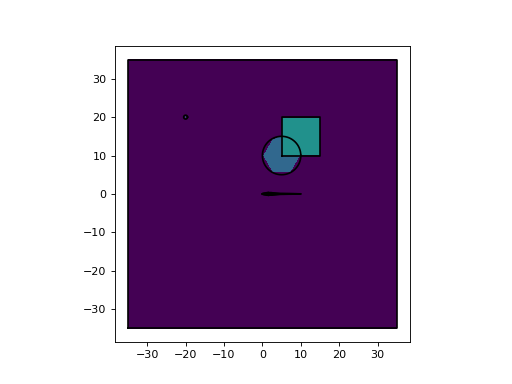
model = StackingClass()
model.compile(fish_x=[0, 10], fish_y=[0, 0])
model.plot_domains()
model.plot_geometry(color="k")
(Source code, png, hires.png, pdf)

Since the square was added after the circle the square overlaps the circle. However had this been the other way around the circle will have covered the square.
Boundary Conditions
Boundaries are the edges of a domain, for example a square would have 4 boundaries (edges). On boundaries the voltage or current can be perscribed to create what’s known as a source.
Boundary conditions apply sources to the model, for example the fish’s electric organ is one such source. If you added a stimulation electrode that would be another boundary condition.
Note
Note to the user: unless you are adding stimulation electrodes you do not need to understand creating boundary conditions
Most boundaries can be automatically labeled. When two domains intersect they form an edge (boundary) since most boundaries will be with the water then that edge can be unambiguously named with the same id of the custom domain.
If there are no overlapping domains (except the obvious object/water overlap) then all boundaries can be automatically labeled. If you need to do custom boundary labeling it’s likely you’re either doing something very custom or making an error - in either case please contact us or raise an issue on Github for support.
Note
Here we will solve the model to highlight the changes. Details of this code will be explained in later sections. Additionally the plotting tutorials can be found here
Boundary Condition Objects
To keep things simple defining boundary conditions takes a BoundaryCondition object. Where we specify a label and a
value. The label specifies which boundary is having the condition applied and the value is the value of the source. For
example 15 could be 15V for a voltage source.
from fish2eod import BoundaryCondition
bc = BoundaryCondition(label=7, value=15)
In this example we’ll pretend we have a 15 volt voltage source applied to label 7 (whatever that may be refering to). In
practice you’d want to get the label from fish2eod. We can then use this bc object to set the boundary condition
appropriately.
Generally speaking boundaries will have the same label as the domain owning it. If the boundary is between any domain and the background. For example an electrode circle may be domain 8, in which case if its only touching the water it is also boundary 8.
Dirichelet Condition (Constant Voltage)
Dirichelet boundary conditions apply a constant voltage to an edge. For example the ground is a dirichelet boundary as it has a defined voltage of 0. For example a small point source would represent an electrode with a fixed voltage (hooked up to a battery for example).
In order to define a dirichelet condition we override the add_voltage_sources method, which returns a tuple of
boundary conditions.
Here we will set a 100mV source on a circular stimulus
"""Example with Dirichelet conditions (voltage sources)."""
from fish2eod import BaseFishModel, BoundaryCondition, Circle, plotting
class ExampleVoltageSource(BaseFishModel):
"""Example model with an additional voltage source."""
def add_geometry(self, **kwargs):
"""Add a circular object to carry the voltage."""
source = Circle([0, 3], 1)
self.model_geometry.add_domain("fg", source, sigma=1)
def add_voltage_sources(self, **kwargs):
"""Add a voltage source to the circle"""
# We can pull the domain id of the "fg" domain from the model geometry
# value=0.1 means that the dirichelet condition is 0.1V. i.e. a 100mV source
return (BoundaryCondition(value=0.1, label=self.model_geometry["fg"]),)
"""
Compile and solve the model
Plot the result with a color bar
"""
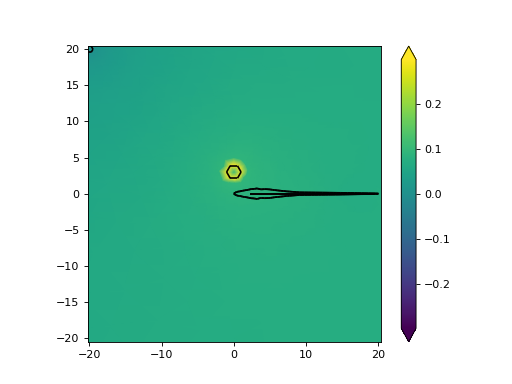
model = ExampleVoltageSource()
model.compile(fish_x=[0, 20], fish_y=[0, 0])
model.solve(fish_x=[0, 20], fish_y=[0, 0])
plotting.plot_outline(model.solution, color="k")
plotting.mesh_plot_2d(model.solution, "solution", colorbar=True)
(Source code, png, hires.png, pdf)

Neumann Condition (Constant Current)
Neumann boundary conditions apply a constant current to an edge. For example the organ is a Neumann boundary with a complicated condition. Other examples would include an isolated current stimulator often used in experimental setups.
In order to define a Neumann condition we override the add_current_sources method, which returns a tuple of
boundary conditions.
Here we will set the same circular object to -3uA/cm^2
"""Example with Neumann conditions (current sources)."""
from fish2eod import BaseFishModel, BoundaryCondition, Circle, plotting
class ExampleCurrentSource(BaseFishModel):
"""Example model with an additional voltage source."""
def add_geometry(self, **kwargs):
"""Add a circular object to carry the current."""
source = Circle([0, 3], 1)
self.model_geometry.add_domain("fg", source, sigma=1)
def add_current_sources(self, **kwargs):
"""Add a voltage source to the circle"""
# We can pull the domain id of the "fg" domain from the model geometry
# value=-3e-6 means that the Neurmann condition is as -3uA/cm^2 source
return (BoundaryCondition(value=-3e-6, label=self.model_geometry["fg"]),)
"""
Compile and solve the model
Plot the result with a color bar
"""
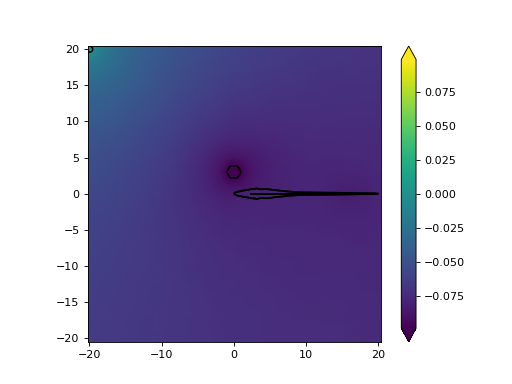
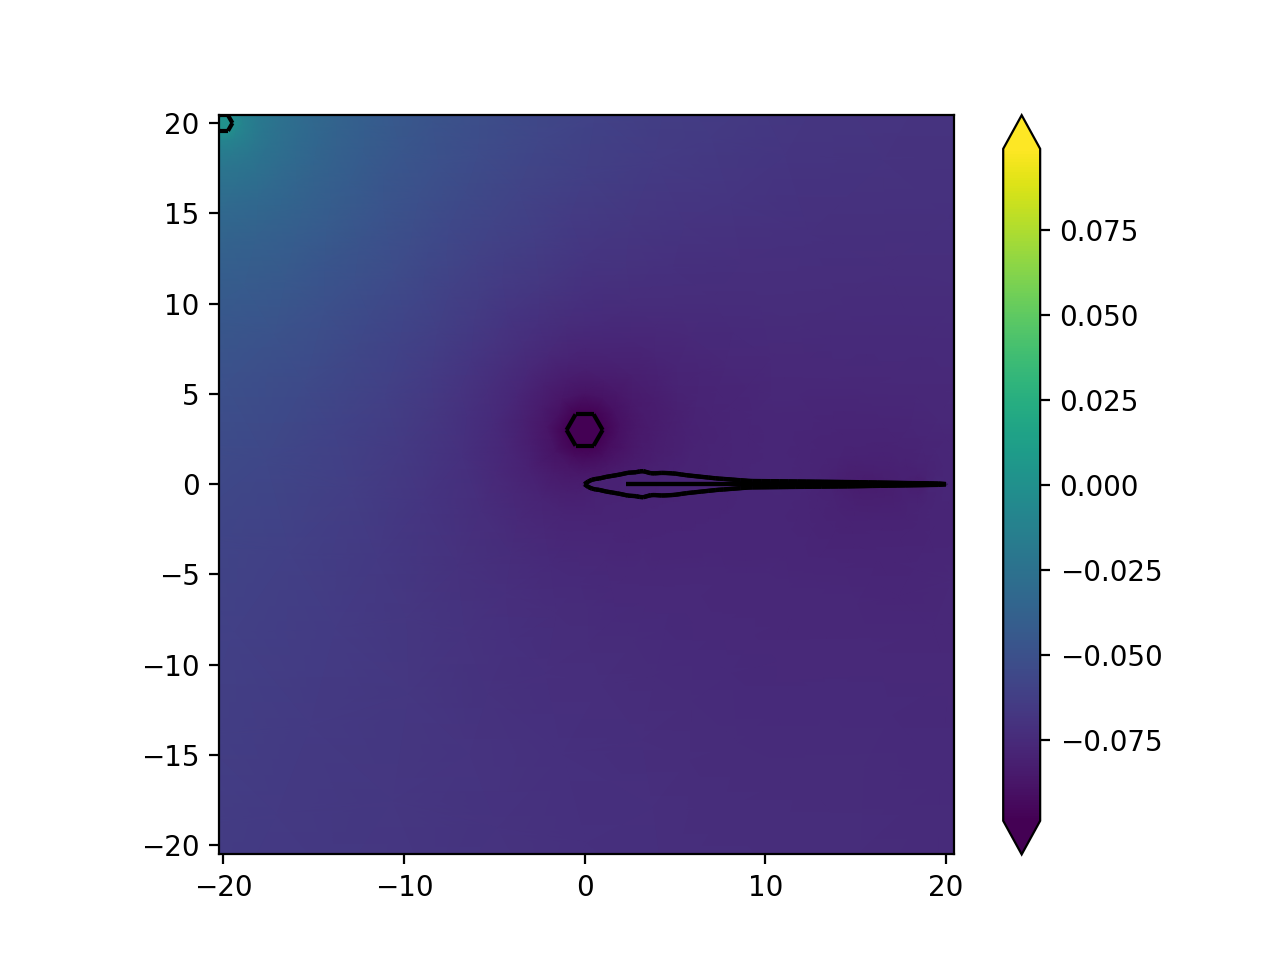
model = ExampleCurrentSource()
model.compile(fish_x=[0, 20], fish_y=[0, 0])
model.solve(fish_x=[0, 20], fish_y=[0, 0])
plotting.plot_outline(model.solution, color="k")
plotting.mesh_plot_2d(model.solution, "solution", colorbar=True)
(Source code, png, hires.png, pdf)
